
Air and Noise Quality Management
Supporting the SDGs Goals
Goal 3:
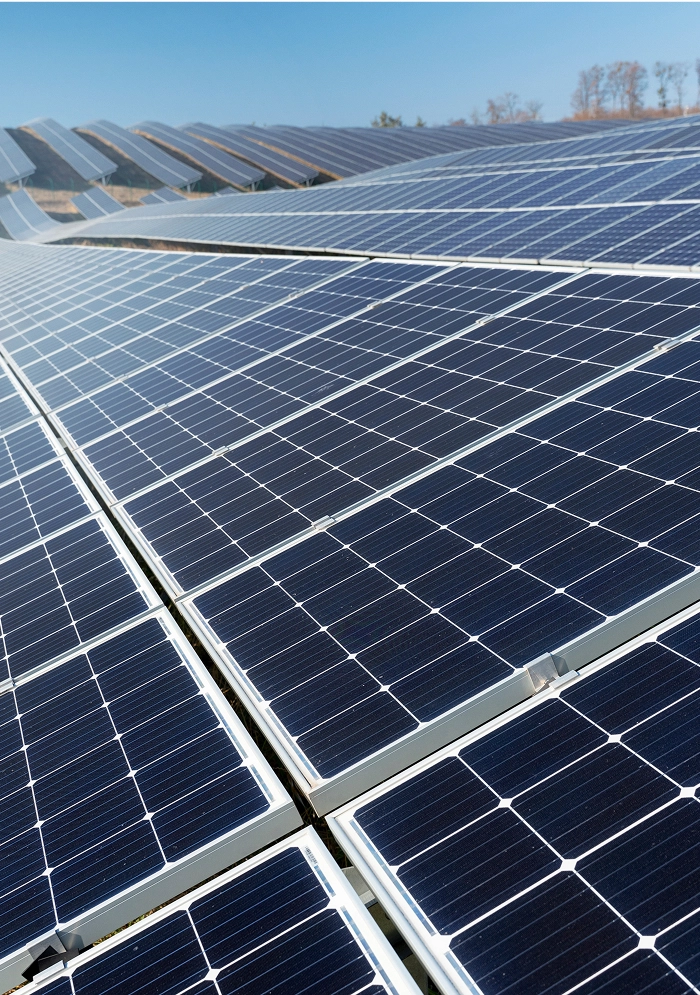
Goal 7:
Goal 11:
Goal 12:
Goal and Performance Highlights
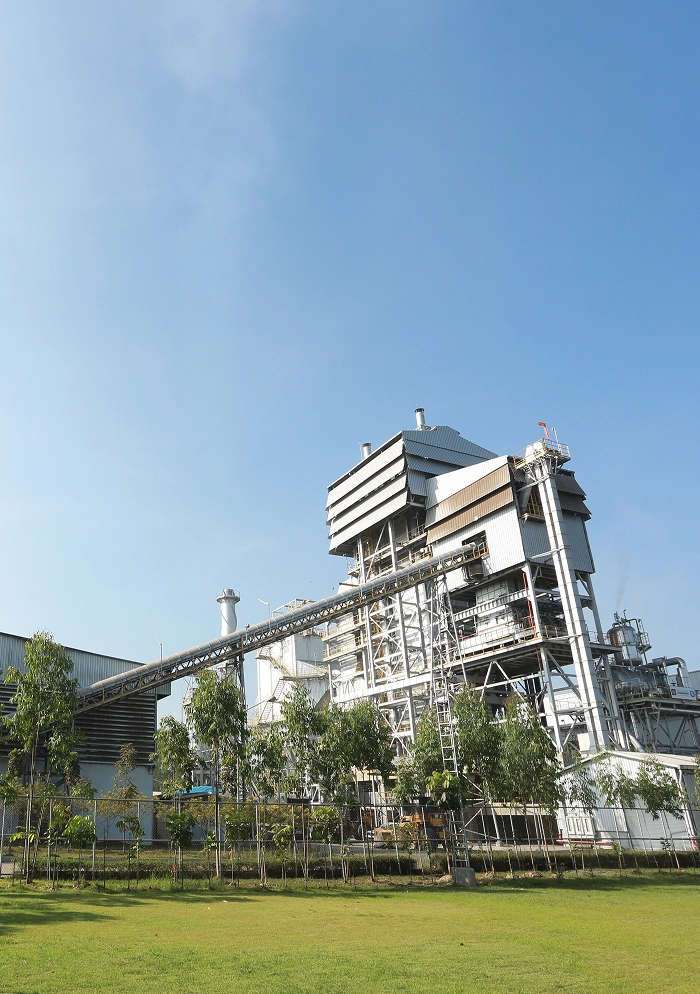
Ratch Pathana Energy Power Plant
Goal: Nitrogen Oxides (NOx)
Performance
Goal: Sulfur dioxide (SO2)
Performance
Goal: Total Suspended Particulates (TSP)
Performance
Sahacogen Green Power Plant
Goal: Nitrogen Oxides (NOx)
Performance
Goal: Sulfur dioxide (SO2)
Performance
Goal: Total Suspended Particulates (TSP)
Performance
Sahagreen Forest Power Plant
Goal: Nitrogen Oxides (NOx)
Performance
Goal: Sulfur dioxide (SO2)
Performance
Goal: Total Suspended Particulates (TSP)
Performance
Challenges and Opportunities
The operation of power plants inevitably involves the release of exhaust gases resulting from the combustion of various fuels. Recognizing the potential environmental impact, the Company places a high priority on the strict control and management of air quality—both within the plant premises and in surrounding areas that may be affected by power generation activities.
Emissions released from the power plants are rigorously monitored and managed to comply with applicable national and international environmental standards and regulations. This is to minimize any adverse effects on the environment and nearby communities. In addition, noise generated from the operation of power generation equipment can significantly affect workers, local residents, and surrounding ecosystems. The Company has therefore implemented targeted measures to mitigate these impacts and uphold its commitment to sustainable and responsible energy production.

Management Approach and Value Creation
Air Quality Management
The company strictly adheres to legal requirements for air quality management as follows:
Air Quality Management
- The power plant is equipped with a Continuous Emission Monitoring System (CEMS) to closely monitor emissions from the combustion process and to help safeguard air quality. This system tracks total suspended particulates (TSP), sulfur dioxide (SOx as SO2), and nitrogen dioxide (NOx as NO2), ensuring that emissions are consistently maintained within regulated standards.
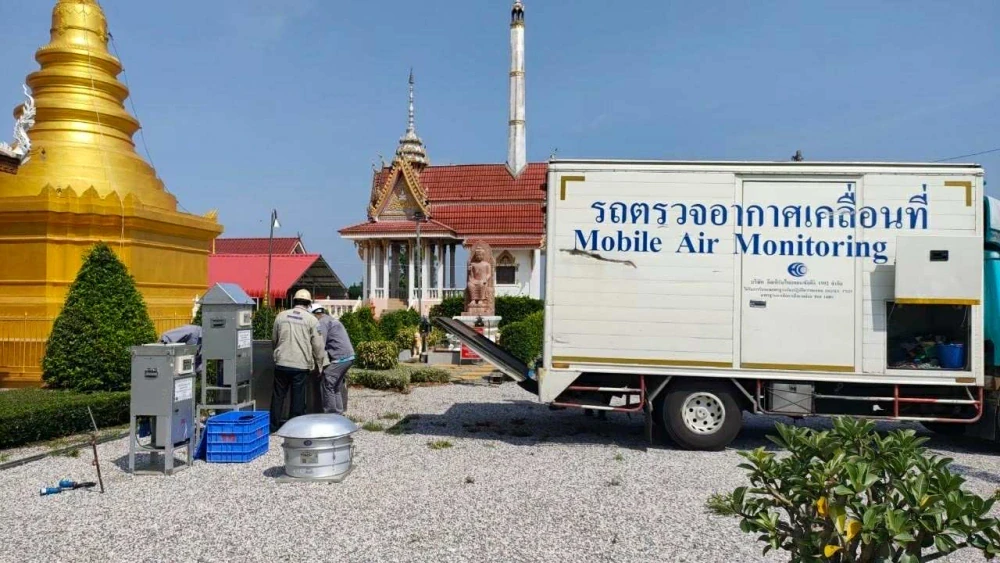
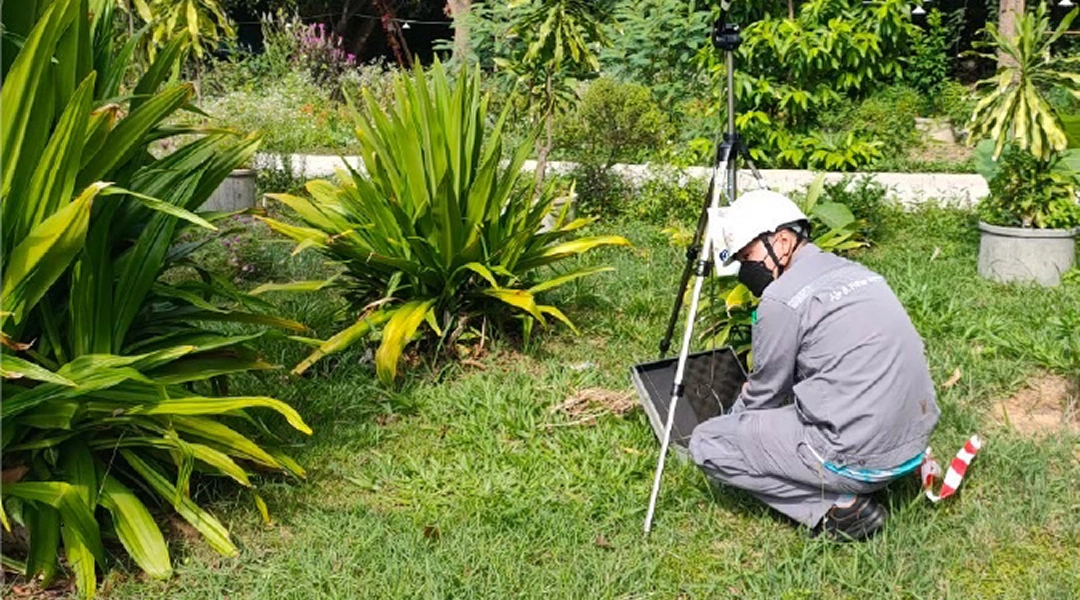
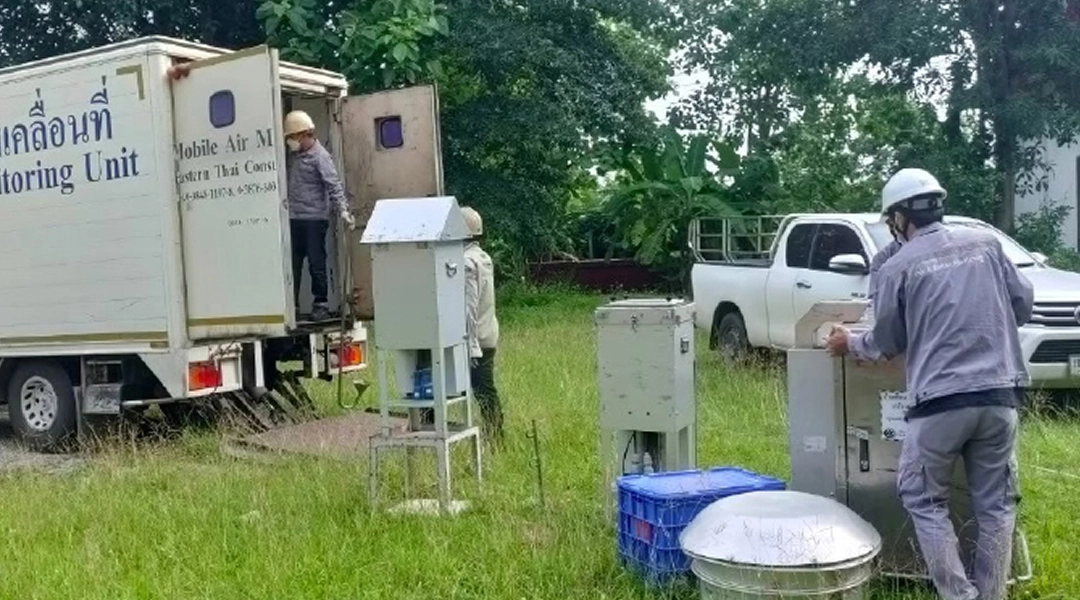
- Air quality measurement equipment is also installed in the surrounding community areas around the plant. The company monitors air quality regularly and prepares environmental monitoring reports to be presented to the community and relevant authorities every 6 months. This is done to ensure continuous monitoring and control of air quality impacts, keeping them within the legal standards.
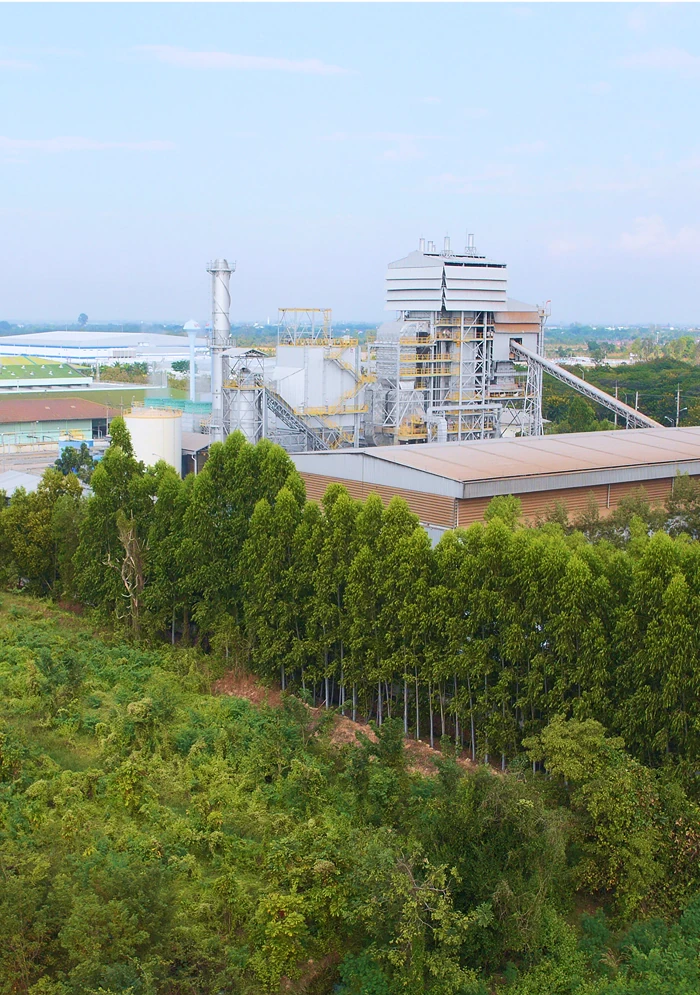
- The company has installed an electrostatic precipitator (ESP) system, which is highly effective in removing over 99.5% of particulate matter from exhaust gases at the Sako-Cogen Green Biomass Power Plant and the Sako-Green Forest Biomass Power Plant. This equipment helps prevent airborne dust pollution from being emitted from the power plants, ensuring that the air released from the stack meets the required air quality standards.
Air Quality Monitoring Results of Ratch Pathana and Affiliates Power Plants (2023–2025)
| Average Monitoring Results (Min-Max) | Legal Criteria | |||
|---|---|---|---|---|
| 2023 | 2024 | 2025 | ||
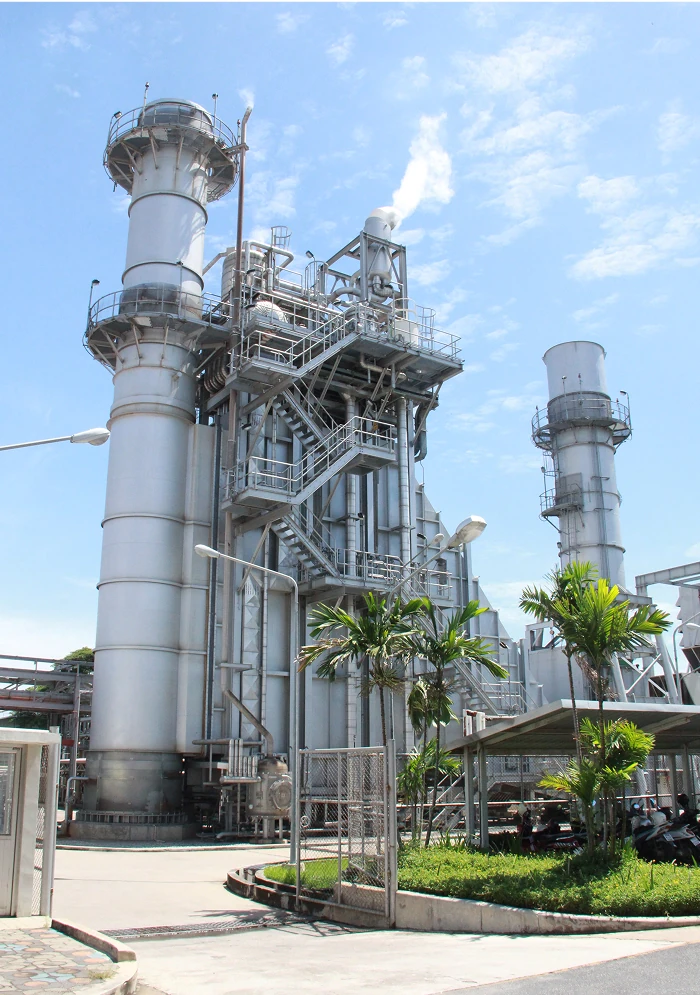
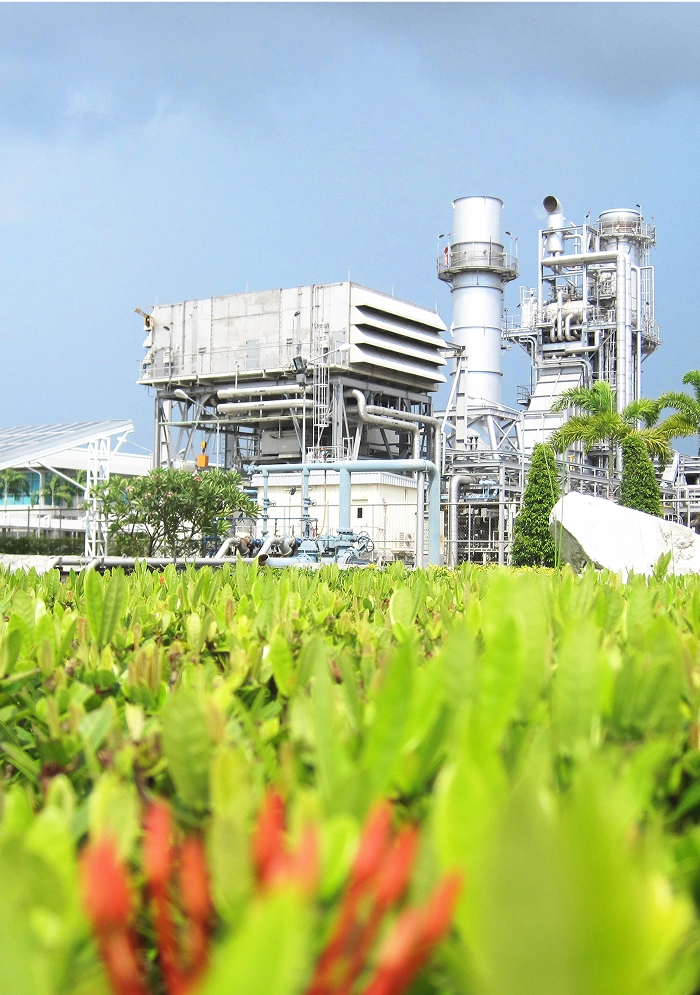
| Natural Gas Power Plant | ||||
| Ratch Pathana Energy Power Plant | ||||
| Total Suspended Particulates (TSP) (mg/m3) | 0.4-3.52 | 4.91-13.10 | 1.30-2.85 | ≤ 54 |
| Sulfur Dioxide (SOx as SO2) (ppm) | 0.07-1.3 | 0.18-0.83 | 0.01-1.48 | ≤ 18 |
| Nitrogen Dioxide (NOx as NO2) (ppm) | 30.5-70.99 | 17.32-65.7 | 15.16-82.49 | ≤ 108 |
| Fine Particulate Matter (PM 2.5) (ug/m3) | ||||
| Ban Nong Kham Community | - | 20.2-27.0 | 8.0-18.0 | ≤ 37.5 |
| Ban Huai Lek Community | - | 24.6-29.6 | <2.0-35.8 | ≤ 37.5 |
| Nisarat Kindergarten | - | 22.8-29.4 | 10.5-18.8 | ≤ 37.5 |
| Nong Phang Phuai Community | - | 17.6-31.3 | 9.1-33.8 | ≤ 37.5 |
| Biomass Power Plants | ||||
| Sahacogen Green Biomass Power Plant | ||||
| Total Suspended Particulates (TSP) (mg/m3) | 5.4-10 | 1.6-8.6 | 20-57 | ≤ 120 |
| Sulfur Dioxide (SOx as SO2) (ppm) | < 1.4 | 3.7-4.3 | <1.0 | ≤ 60 |
| Nitrogen Dioxide (NOx as NO2) (ppm) | 65.8-77.1 | 209.4-216.4 | 124-157 | ≤ 200 |
| Fine Particulate Matter (PM 2.5) (ug/m3) | ||||
| Nong Pla Kho Temple | 11.4-36.0 | 14.9-33.0 | 2.1-24.1 | ≤ 37.5 |
| San Luang Temple | 0.046-0.140 | 16.5-33.2 | 2.2-23.4 | ≤ 37.5 |
| Sahagreen Forest Biomass Power Plant | ||||
| Total Suspended Particulates (TSP) (mg/m3) | 39.4-52.8 | 2.8-11.5 | 49.2-112.4 | ≤ 120 |
| Sulfur Dioxide (SOx as SO2) (ppm) | <1.4 | 1.6-3.8 | <1.0 | ≤ 60 |
| Nitrogen Dioxide (NOx as NO2) (ppm) | 4-72.4 | 45.1-102.7 | 0.4-0.9 | ≤ 200 |
| Fine Particulate Matter (PM 2.5) (ug/m3) | ||||
| Ban Huai Nam Sai School | 35-37.2 | 1.3-62.0* | 3.1-36.7 | ≤ 37.5 |
| Ban Khui Pom Sub-district Health Promotion Hospital | 34.3-37.3 | 3.6-55.0* | 1.3-34.4 | ≤ 37.5 |
Note:
* Although these measurements exceeded the standard threshold in certain periods, a comprehensive environmental assessment, which considered stack emission monitoring results in conjunction with meteorological data such as wind speed and direction, indicated that the dispersion pattern of pollutants did not impact the surrounding communities. Therefore, it can be reasonably concluded that the project activities did not adversely affect air quality in community areas. The measured values more likely reflect the general dispersion characteristics of pollutants in the overall area rather than direct impacts on the communities.
Noise Pollution Management

Equipment and machinery are designed, installed, and maintained

Three noise monitoring points have been established

Hearing protection equipment (earmuffs)
Noise Quality Monitoring Results for Ratch Pathana and Affiliates, 2023-2025
| Average Measurement Results (Min-Max) | Legal Criteria | |||
|---|---|---|---|---|
| 2023 | 2024 | 2025 | ||
| Ratch Pathana Energy Power Plant | ||||
| General Noise Level (Leq 24 hr) (dBA) | ||||
| Northern Project Fence Perimeter | - | 64.4-67.5 | 63.7-65.1 | 70 |
| Eastern Project Fence Perimeter | - | 60.1-63.5 | 60.3-65.9 | 70 |
| Southern Project Fence Perimeter | - | 64.9-67.4 | 65.0-68.9 | 70 |
| Western Project Fence Perimeter | 61.8-64.0 | 65.9-68.3 | 63.1-65.3 | 70 |
| Ban Rai Nueng Area | 63.4-64.0 | 58.7-68.3 | 56.0-57.1 | 70 |
| Workplace Noise Level - Personal Noise Dosimetry (Leq 12 hr) (dBA) | 78.1-79.9 | 73.1-77.6 | 75.7-80.1 | 83 |
| Sahacogen Green Biomass Power Plan | ||||
| General Noise Level (Leq 24 hr) | ||||
| Nong Pla Kho Temple Area | 46.6-60.7 | 48.9-60.4 | 48.5-51.7 | 70 |
| San Luang Temple Area | 45.8-63.3 | 46.8-52.6 | 51.8-56.5 | 70 |
| Project Fence Perimeter | 54.8-65.2 | 64.5-66.6 | 59.3-65.3 | 70 |
| Workplace Noise Level - Personal Noise Dosimetry (Leq 12 hr) | 81-82.1 | 76.1-78.6 | 75.3-81.3 | 83 |
| Sahagreen Forest Biomass Power Plant | ||||
| General Noise Level (Leq 24 hr) | ||||
| Ban Huai Nam Sai School | 47.6-56.7 | 48.5-67.3 | 49.2-60.9 | 70 |
| Si Chumphorn Wirawat Temple (Rai Dong Temple) | 65.0-67.5 | 47.8-65.5 | 48.9-69.2 | 70 |
| Project Fence Perimeter | 51.3-58.5 | 64.6-67.4 | 65.3-66.1 | 70 |
| Workplace Noise Level - Personal Noise Dosimetry (Leq 12 hr) | 78.6-80.3 | 79.6-82.0 | 70.3-80.2 | 83 |
Chemical Leakage Statistics (Volatile Organic Compounds: VOC)
During the past three years (2023-2025), there have been no incidents of Volatile Organic Compounds (VOC) leakage.
| Incident/Issue | Number of Occurrences (Times) | ||
|---|---|---|---|
| 2023 | 2024 | 2025 | |
| Chemical Leakage | 0 | 0 | 0 |